Bind Date In Chart Using Datebase IN 3 Tier in C#.
First of all create table in database like

ON ASPX PAGE :-
<asp:Chart ID="Chart1" runat="server" ViewStateMode="Enabled" Width="700PX" Height="400PX"
BackColor="Wheat">
<Titles>
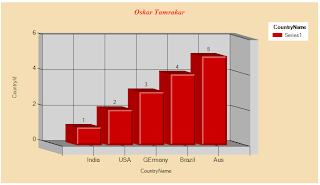
<asp:Title Font="Times New Roman, 12pt, style=Bold, Italic" ForeColor="Red" Name="Title"
Text="Oskar Tamrakar">
</asp:Title>
</Titles>
<Series>
<asp:Series Name="Series1" ToolTip="Percentage" ChartArea="ChartArea1" ChartType="Column"
YValuesPerPoint="4" LegendToolTip="COuntry Name" Color="#CC0000">
</asp:Series>
</Series>
<ChartAreas>
<asp:ChartArea Name="ChartArea1">
<Area3DStyle Enable3D="True" IsClustered="True" LightStyle="Realistic" Rotation="-20"
WallWidth="20" Inclination="10" />
</asp:ChartArea>
</ChartAreas>
</asp:Chart>
ON CODE BEHIND :-
Name space :-
using System.Linq;
using System.Web;
using System.Web.Security;
using System.Web.UI;
using System.Web.UI.WebControls.WebParts;
using System.Web.UI.HtmlControls;
using System.Data.SqlClient;
using System.Data.SqlTypes;
using BusinessLayer.Entity;
using BusinessLayer.Manager;
using DataLayer.Data;
using System.Drawing;
using System.Text;
using System.IO;
using System.Drawing.Imaging;
protected void Page_Load(object sender, EventArgs e)
{
bind();
}
private void bind()
{
DataSet ds = new DataSet();
ds = manager.Getcounrtyrecordsbyname();//stored procedure using 3 tier
Chart1.DataSource = ds.Tables[0];
Chart1.DataBind();
Chart1.Legends.Add("CountryName").Title = "CountryName";
Chart1.Series["Series1"]["DrawingStyle"] = "Emboss";
Chart1.ChartAreas["ChartArea1"].Area3DStyle.Enable3D = true;
Chart1.Series["Series1"].IsValueShownAsLabel = true;
Chart1.ChartAreas["ChartArea1"].AxisX.Title = "CountryName";
Chart1.ChartAreas["ChartArea1"].AxisY.Title = "CountryId";
Chart1.Series["Series1"].XValueMember = "CountryName";
Chart1.Series["Series1"].YValueMembers = "CountryId";
}
ON BUSSINESS LAYER :-
public static DataSet Getcounrtyrecordsbyname()
{
return NGODataLayer.Group.Getcounrtyrecordsbyname();
}
ON DATALAYER :-
public static DataSet Getcounrtyrecordsbyname()
{
return BusinessLayer.Dataaccess.DataAccess.GetData("usp_task6selectcountrytable", null);
}
IN DATALAYER ADD CLASS DATA.CS :-
Ans paste code for GETDATA function.
public static DataSet GetData(string SPName, List<SqlParameter> Parameters)
{
using (SqlConnection con = new SqlConnection(System.Configuration.ConfigurationManager.ConnectionStrings["ApplicationServices"].ConnectionString))
{
using (SqlCommand cmd = new SqlCommand())
{
cmd.CommandText = SPName;
cmd.CommandType = System.Data.CommandType.StoredProcedure;
cmd.Connection = con;
if (Parameters != null)
{
foreach (SqlParameter parameter in Parameters)
{
cmd.Parameters.Add(parameter);
}
}
con.Open();
DataSet ds = new DataSet();
SqlDataAdapter da = new SqlDataAdapter();
da.SelectCommand = cmd;
da.Fill(ds);
con.Close();
return ds;
}
}
}
Just change CHART TYPE IN ASPX PAGE and get different type of chart

First of all create table in database like
ON ASPX PAGE :-
<asp:Chart ID="Chart1" runat="server" ViewStateMode="Enabled" Width="700PX" Height="400PX"
BackColor="Wheat">
<Titles>
<asp:Title Font="Times New Roman, 12pt, style=Bold, Italic" ForeColor="Red" Name="Title"
Text="Oskar Tamrakar">
</asp:Title>
</Titles>
<Series>
<asp:Series Name="Series1" ToolTip="Percentage" ChartArea="ChartArea1" ChartType="Column"
YValuesPerPoint="4" LegendToolTip="COuntry Name" Color="#CC0000">
</asp:Series>
</Series>
<ChartAreas>
<asp:ChartArea Name="ChartArea1">
<Area3DStyle Enable3D="True" IsClustered="True" LightStyle="Realistic" Rotation="-20"
WallWidth="20" Inclination="10" />
</asp:ChartArea>
</ChartAreas>
</asp:Chart>
ON CODE BEHIND :-
Name space :-
using System.Linq;
using System.Web;
using System.Web.Security;
using System.Web.UI;
using System.Web.UI.WebControls.WebParts;
using System.Web.UI.HtmlControls;
using System.Data.SqlClient;
using System.Data.SqlTypes;
using BusinessLayer.Entity;
using BusinessLayer.Manager;
using DataLayer.Data;
using System.Drawing;
using System.Text;
using System.IO;
using System.Drawing.Imaging;
protected void Page_Load(object sender, EventArgs e)
{
bind();
}
private void bind()
{
DataSet ds = new DataSet();
ds = manager.Getcounrtyrecordsbyname();//stored procedure using 3 tier
Chart1.DataSource = ds.Tables[0];
Chart1.DataBind();
Chart1.Legends.Add("CountryName").Title = "CountryName";
Chart1.Series["Series1"]["DrawingStyle"] = "Emboss";
Chart1.ChartAreas["ChartArea1"].Area3DStyle.Enable3D = true;
Chart1.Series["Series1"].IsValueShownAsLabel = true;
Chart1.ChartAreas["ChartArea1"].AxisX.Title = "CountryName";
Chart1.ChartAreas["ChartArea1"].AxisY.Title = "CountryId";
Chart1.Series["Series1"].XValueMember = "CountryName";
Chart1.Series["Series1"].YValueMembers = "CountryId";
}
ON BUSSINESS LAYER :-
public static DataSet Getcounrtyrecordsbyname()
{
return NGODataLayer.Group.Getcounrtyrecordsbyname();
}
ON DATALAYER :-
public static DataSet Getcounrtyrecordsbyname()
{
return BusinessLayer.Dataaccess.DataAccess.GetData("usp_task6selectcountrytable", null);
}
IN DATALAYER ADD CLASS DATA.CS :-
Ans paste code for GETDATA function.
public static DataSet GetData(string SPName, List<SqlParameter> Parameters)
{
using (SqlConnection con = new SqlConnection(System.Configuration.ConfigurationManager.ConnectionStrings["ApplicationServices"].ConnectionString))
{
using (SqlCommand cmd = new SqlCommand())
{
cmd.CommandText = SPName;
cmd.CommandType = System.Data.CommandType.StoredProcedure;
cmd.Connection = con;
if (Parameters != null)
{
foreach (SqlParameter parameter in Parameters)
{
cmd.Parameters.Add(parameter);
}
}
con.Open();
DataSet ds = new DataSet();
SqlDataAdapter da = new SqlDataAdapter();
da.SelectCommand = cmd;
da.Fill(ds);
con.Close();
return ds;
}
}
}

Just change CHART TYPE IN ASPX PAGE and get different type of chart

No comments:
Post a Comment